Home/Features/Data Analysis
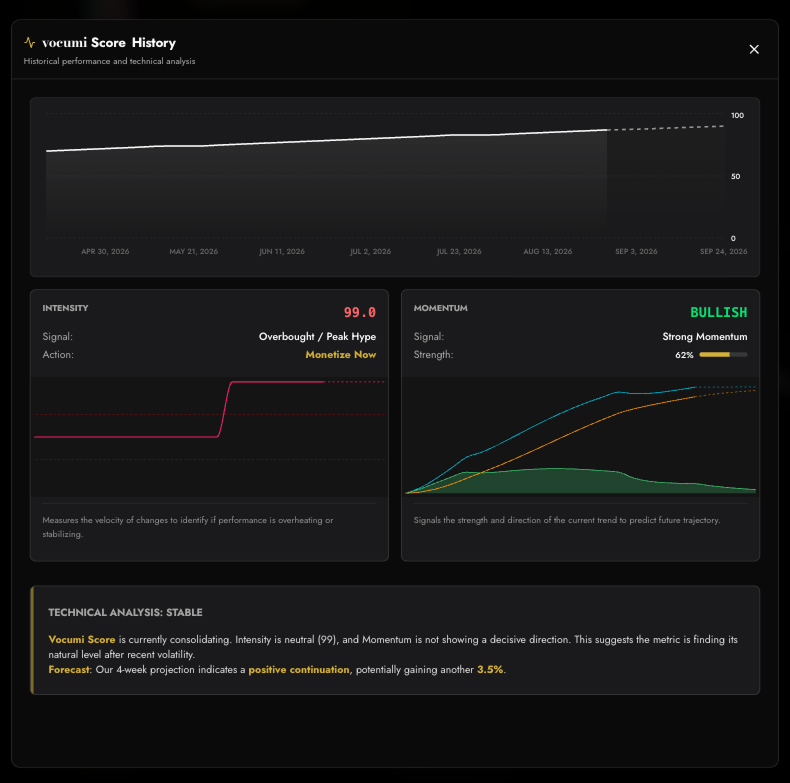
For artists already on your shortlist, Technical Analysis helps you understand whether growth is accelerating, stabilizing, or changing direction. Use Intensity and Momentum to add timing context to the signals you are already watching.
Plans for every stage of A&R
Transparent pricing. Pick the desk that fits. Compare full limits below when you are ready.
Free
21 days of Pro. No card.
Explore vocumi with 21 days of Pro access. Start without a card and experience the full Pro workflow before choosing a plan.
Basic
billed $299.99/yr
excl. VAT
For solo scouts and independent labels. A focused workspace for building a roster, searching for artists and podcasts, and getting started with core Insights.
Pro
billed $699.99/yr
excl. VAT
For professional A&R desks and managers. A full scouting workspace with Vibe Search, Pulse, Scouting Pool, advanced Insights, comparisons, technical analysis, and reporting.
Team
billed $2999.99/yr
excl. VAT
For agencies and labels working together. Bring multiple Pro seats into one shared roster and workspace so teams can discover, evaluate, track, and discuss talent together.
Prices exclude VAT. Lemon Squeezy (Merchant of Record) applies your local VAT at checkout.
Not Just Up or Down. Is It Real?
Two proprietary indicators separate genuine career momentum from short-lived noise, before you make the call.
Intensity
SPIKE DETECTORIntensity surfaces the velocity behind a metric, spotting emerging breakouts before they become obvious.
Momentum
TREND STRENGTHMomentum confirms whether a trend is genuine and sustained, or a one-off blip not worth chasing.
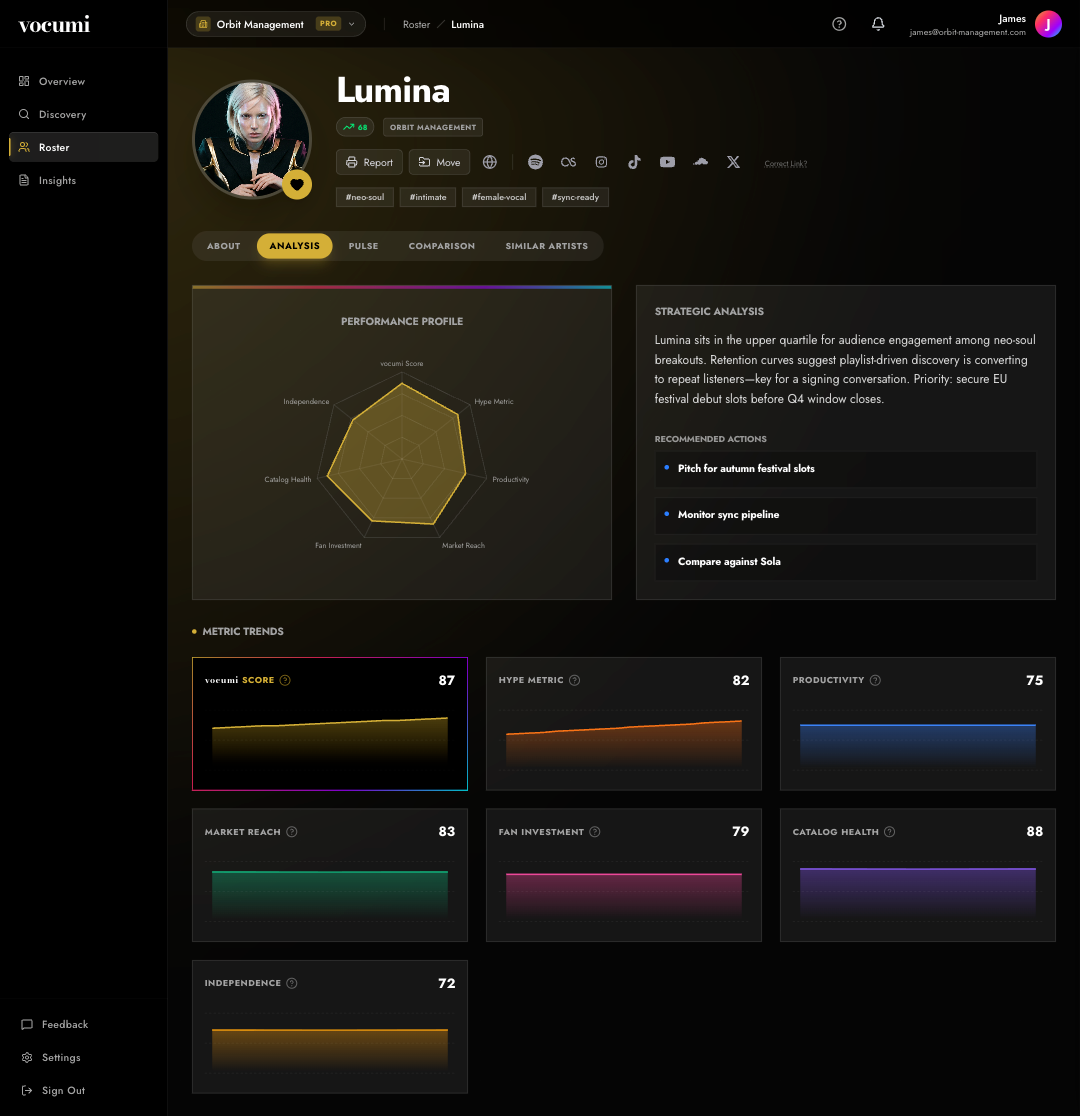
Seven Metrics. One Picture. Total Clarity.
Radar chart
maps five career dimensions (Productivity, Fan Investment, Market Reach, Catalog Health, and Independence) so you can see which are strong and which are thin
AI narrative
when generated, interprets what that combination of scores means for this artist
Prioritised action items
when available (HIGH / MEDIUM / LOW): a starting agenda for your next conversation
7
Key metrics
Grows
As we track them
1 view
Analysis tab
Know When to Move. Not Just Who to Move On.
When enough score history exists, the metric overlay can show a directional 4-week forecast. Useful for timing, not a crystal ball.
01
4-Week Direction
With enough weekly snapshots, the metric overlay projects whether a score looks up, down, or flat over the next four weeks. Directional signal, not a guarantee.
02
Platform Benchmark
When enough comparison data exists, a reference line shows the vocumi-wide average for that score: context for whether a number is strong or merely average.
03
Score History
Charts build from when we start tracking an artist. Weekly snapshots that grow over time. Not a full pre-add career archive from every platform.
04
Intensity & Momentum
On eligible plans, the metric deep-dive adds Intensity and Momentum readings plus a short plain-English take on what they mean together right now.
Productivity
Output consistency
Market Reach
Audience scale
Fan Investment
Depth vs size
Catalog Health
Back catalog strength
Independence
Control & rights signal
Stop Watching. Start Deciding.
Every metric you need, every signal that matters: analysed, contextualised, and ready the moment you need to act.
A plan for every
scouting desk.
From solo scouts to collaborative A&R teams, choose the workspace that fits how you work. Start free with 21 days of Pro access. No card required.
21-day Pro trial
After the trial, continue on Free or choose a plan.
Try the full Pro workflow for 21 days. No card required.
- 21 days of Pro
- No card required
- Then Free, a plan, or credits
Basic
billed $299.99/yr
excl. VAT
For solo scouts.
- 10 artists
- Unlimited name search
- Core Insights
Pro
billed $699.99/yr
excl. VAT
For A&R desks.
- 30 artists
- Vibe Search (4/day)
- Similar Artists
- Pulse
- Comparisons and PDF reports
Team
billed $2999.99/yr
excl. VAT
For labels and agencies.
- 5 Pro seats
- Shared roster (150 artists)
- Team management
Prices exclude VAT. Lemon Squeezy (Merchant of Record) applies your local VAT at checkout.
Build a smarter
scouting workflow.
Find talent, understand the signals, track what changes, and bring your shortlist into one place.
Questions, answered.
Everything you need to know about plans, data, discovery, credits, workspaces, and managing your roster.
Compare Every Feature
Side-by-side comparison of every feature across all plans. Find exactly what you need.
Free 21 days of Pro. No card. Free | Basic $299.99 /year −17% vs monthly excl. VAT | Recommended Pro $699.99 /year −17% vs monthly excl. VAT | Team $2999.99 /year −17% vs monthly excl. VAT | |
|---|---|---|---|---|
| Usage Limits | ||||
| User Seats | 1 seat | 1 seat | 1 seat | 5 seats |
| Artist Roster | 2 artists | 10 artists | 30 artists | 150 (30 per seat) |
| Workspaces | 1 | 1 | 2 | 5 |
| Teams per Workspace | 1 team | 4 teams | 5 teams | 10 teams |
| Results per Search | Up to 15 | Up to 25 | Up to 40 | Up to 40 |
| Direct Search | Unlimited | Unlimited | Unlimited | Unlimited |
| Similar Artists | — | Up to 3 per artist | Up to 8 per artist | Up to 8 per artist |
| AI Vibe Search (Artists) | — | — | 4/day | 4/day per seat |
| Artist Pulse | — | — | 3/week | 3/week per seat |
| Artist Analysis summary | — | Generate once | Generate once | Generate once |
| Discovery & Scouting | ||||
| Artist Discovery | ||||
| Podcast Direct Search | Unlimited | Unlimited | Unlimited | Unlimited |
| Podcast Vibe Search | — | — | 4/day | 4/day per seat |
| Podcast Charts | ||||
| Podcast Scouting Pool | ||||
| Similar Podcasts | ||||
| Artist Scouting Pool | ||||
| AI Vibe Search (Artists) | ||||
| Deep Social Discovery | ||||
| Analysis & Intelligence | ||||
| vocumi Score Analysis | ||||
| Core Insights (Scouting & Landscape) | ||||
| Advanced Insights (Commercial & Management) | ||||
| Artist Comparisons | ||||
| Technical Analysis | ||||
| Artist Pulse Metrics | ||||
| Collaboration & Workflow | ||||
| Team Management | ||||
| Workspaces & Teams | ||||
| Weekly Digest Email | ||||
| Breakout alerts | ||||
| Export & Reporting | ||||
| PDF Reports | ||||
Prices exclude VAT. Lemon Squeezy (Merchant of Record) applies your local VAT at checkout.
Run out of included quota? Add credits.
Credits are a wallet, not another subscription. Buy a pack once. Spend it only when you run an action. Unused credits stay until you use them.
After the 21-day Pro trial
Choose a plan, or buy packs
Stay on Free and buy a credit pack when you need Vibe Search, Artist Pulse, extra roster slots, Similar Artists, or a 7-day desk pass. Or subscribe for included quotas.
Already on Basic, Pro, or Team
Quota first, then credits
Your plan covers what is included. When you hit a daily or weekly cap, a pack unlocks more of that action. Included quota never spends credits.
What each action costs
| Action | Credits |
|---|---|
| 7-day desk pass (Insights, Scout, digest, Compare, PDF) | 70 |
| Artist Pulse | 30 |
| Extra artist on your roster | 15 |
| Similar Artists | 10 |
| Artist Analysis summary | 10 |
| Vibe search | 10 |
| Podcast favorite | 5 |
Packs
$5 is 100 credits. Larger packs include a small bonus. Buy in Settings → Billing, or when a feature asks you to add credits.
- $5100 credits
- $10220 credits
- $25600 credits
- $501300 credits
- $1002800 credits
- Credits never expire and are never taken automatically.
- Paid plans use included quota first. Credits only spend when you go past that cap, or for an action your plan does not include.
- On a Team workspace, owners and admins buy packs for everyone.
- After the trial, extras already on the roster stay for 14 days. You cannot add more until you unfavorite, subscribe, or buy extra slots (15 credits each).